Morros Epic
PDFShort-term rental
FromUS$50,00 / fractionInvestProperty value
US$518,4 k
Est. yield
16,8 % /yr
Appreciation
5 %
Horizon
5 years
Morros Epic · Cra. 9 #34-122, La Boquilla, Cartagena de Indias, BolívarOpen in Google Maps
Location
La Boquilla, CartagenaHost & operations
CityFraction
4.9
Operator
CityFraction Stays
Channel
Arriendo directo
Features
Monthly net rent
1,4 % – 1,9 % estimada
Area
112,42 m²
Bedrooms
2
Bathrooms
2
Complex
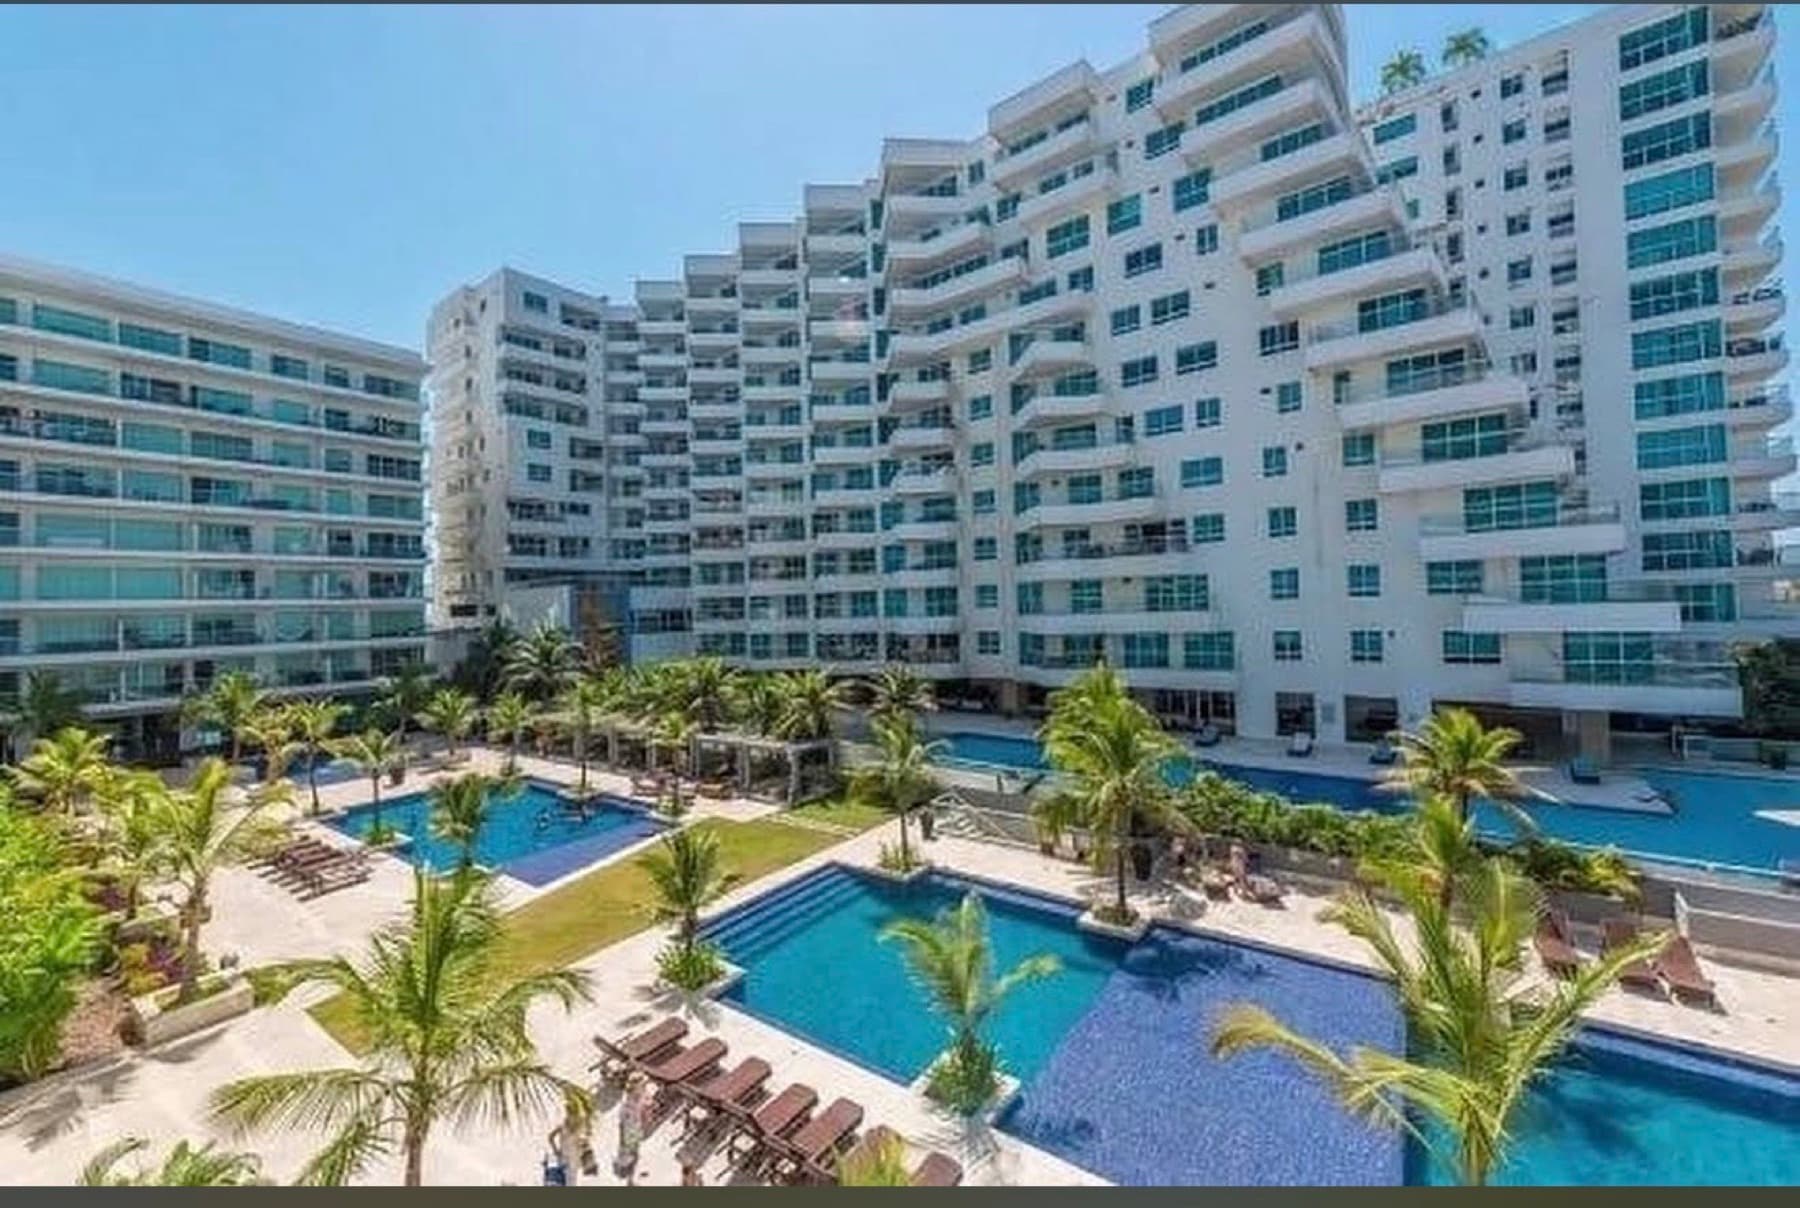
Pools, green areas, and beach access
About the property
2-bedroom apartment in Morros Epic, beachfront in Cartagena’s North Zone: estimated net rent between 1.4% and 1.9% monthly.
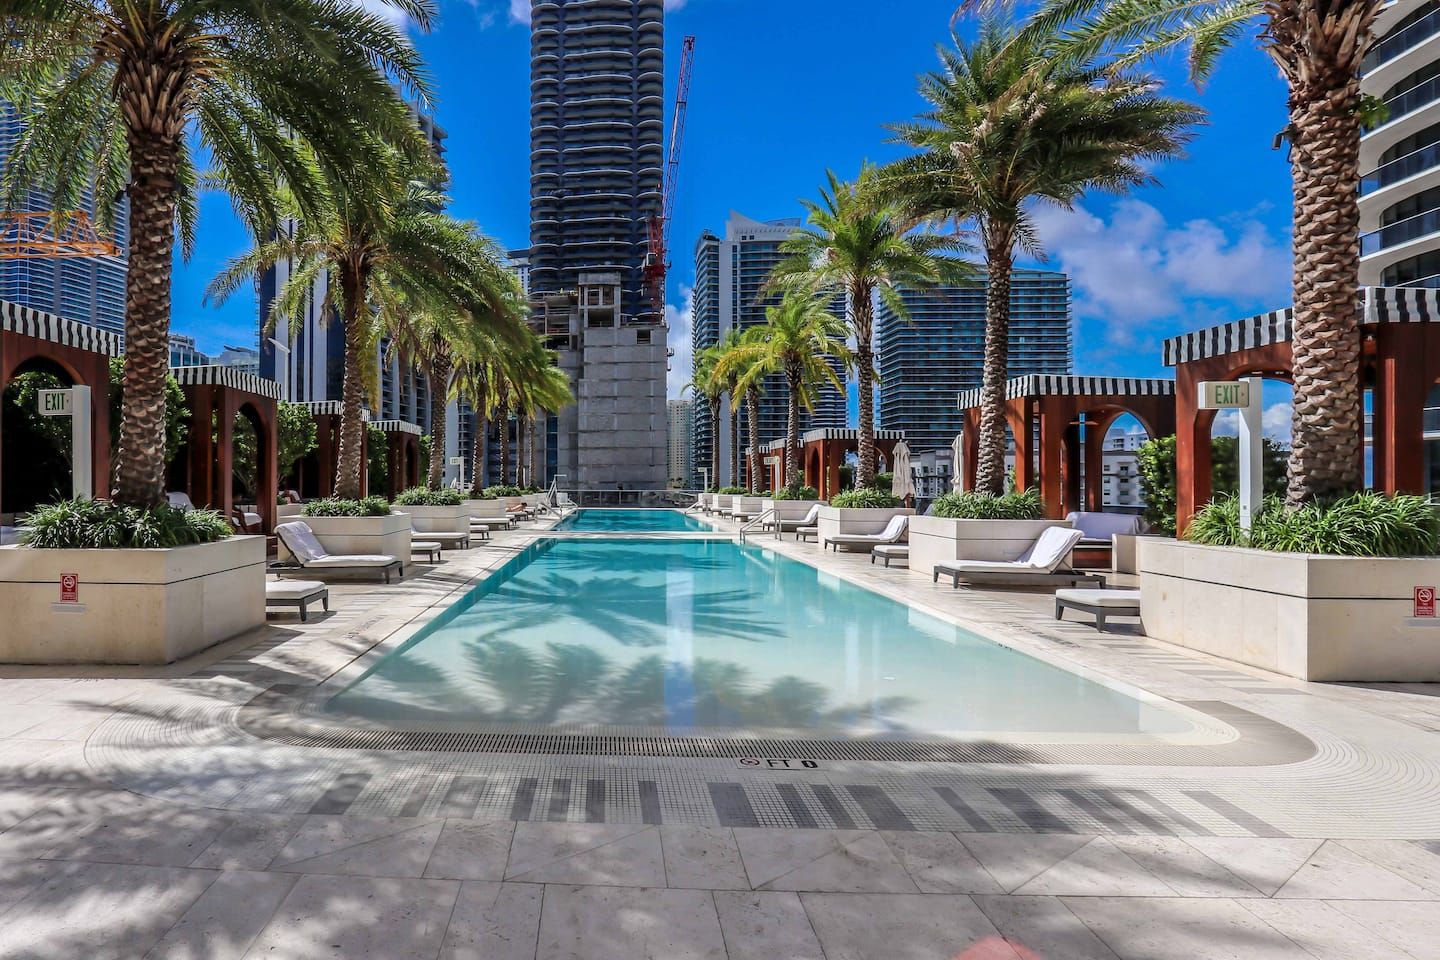
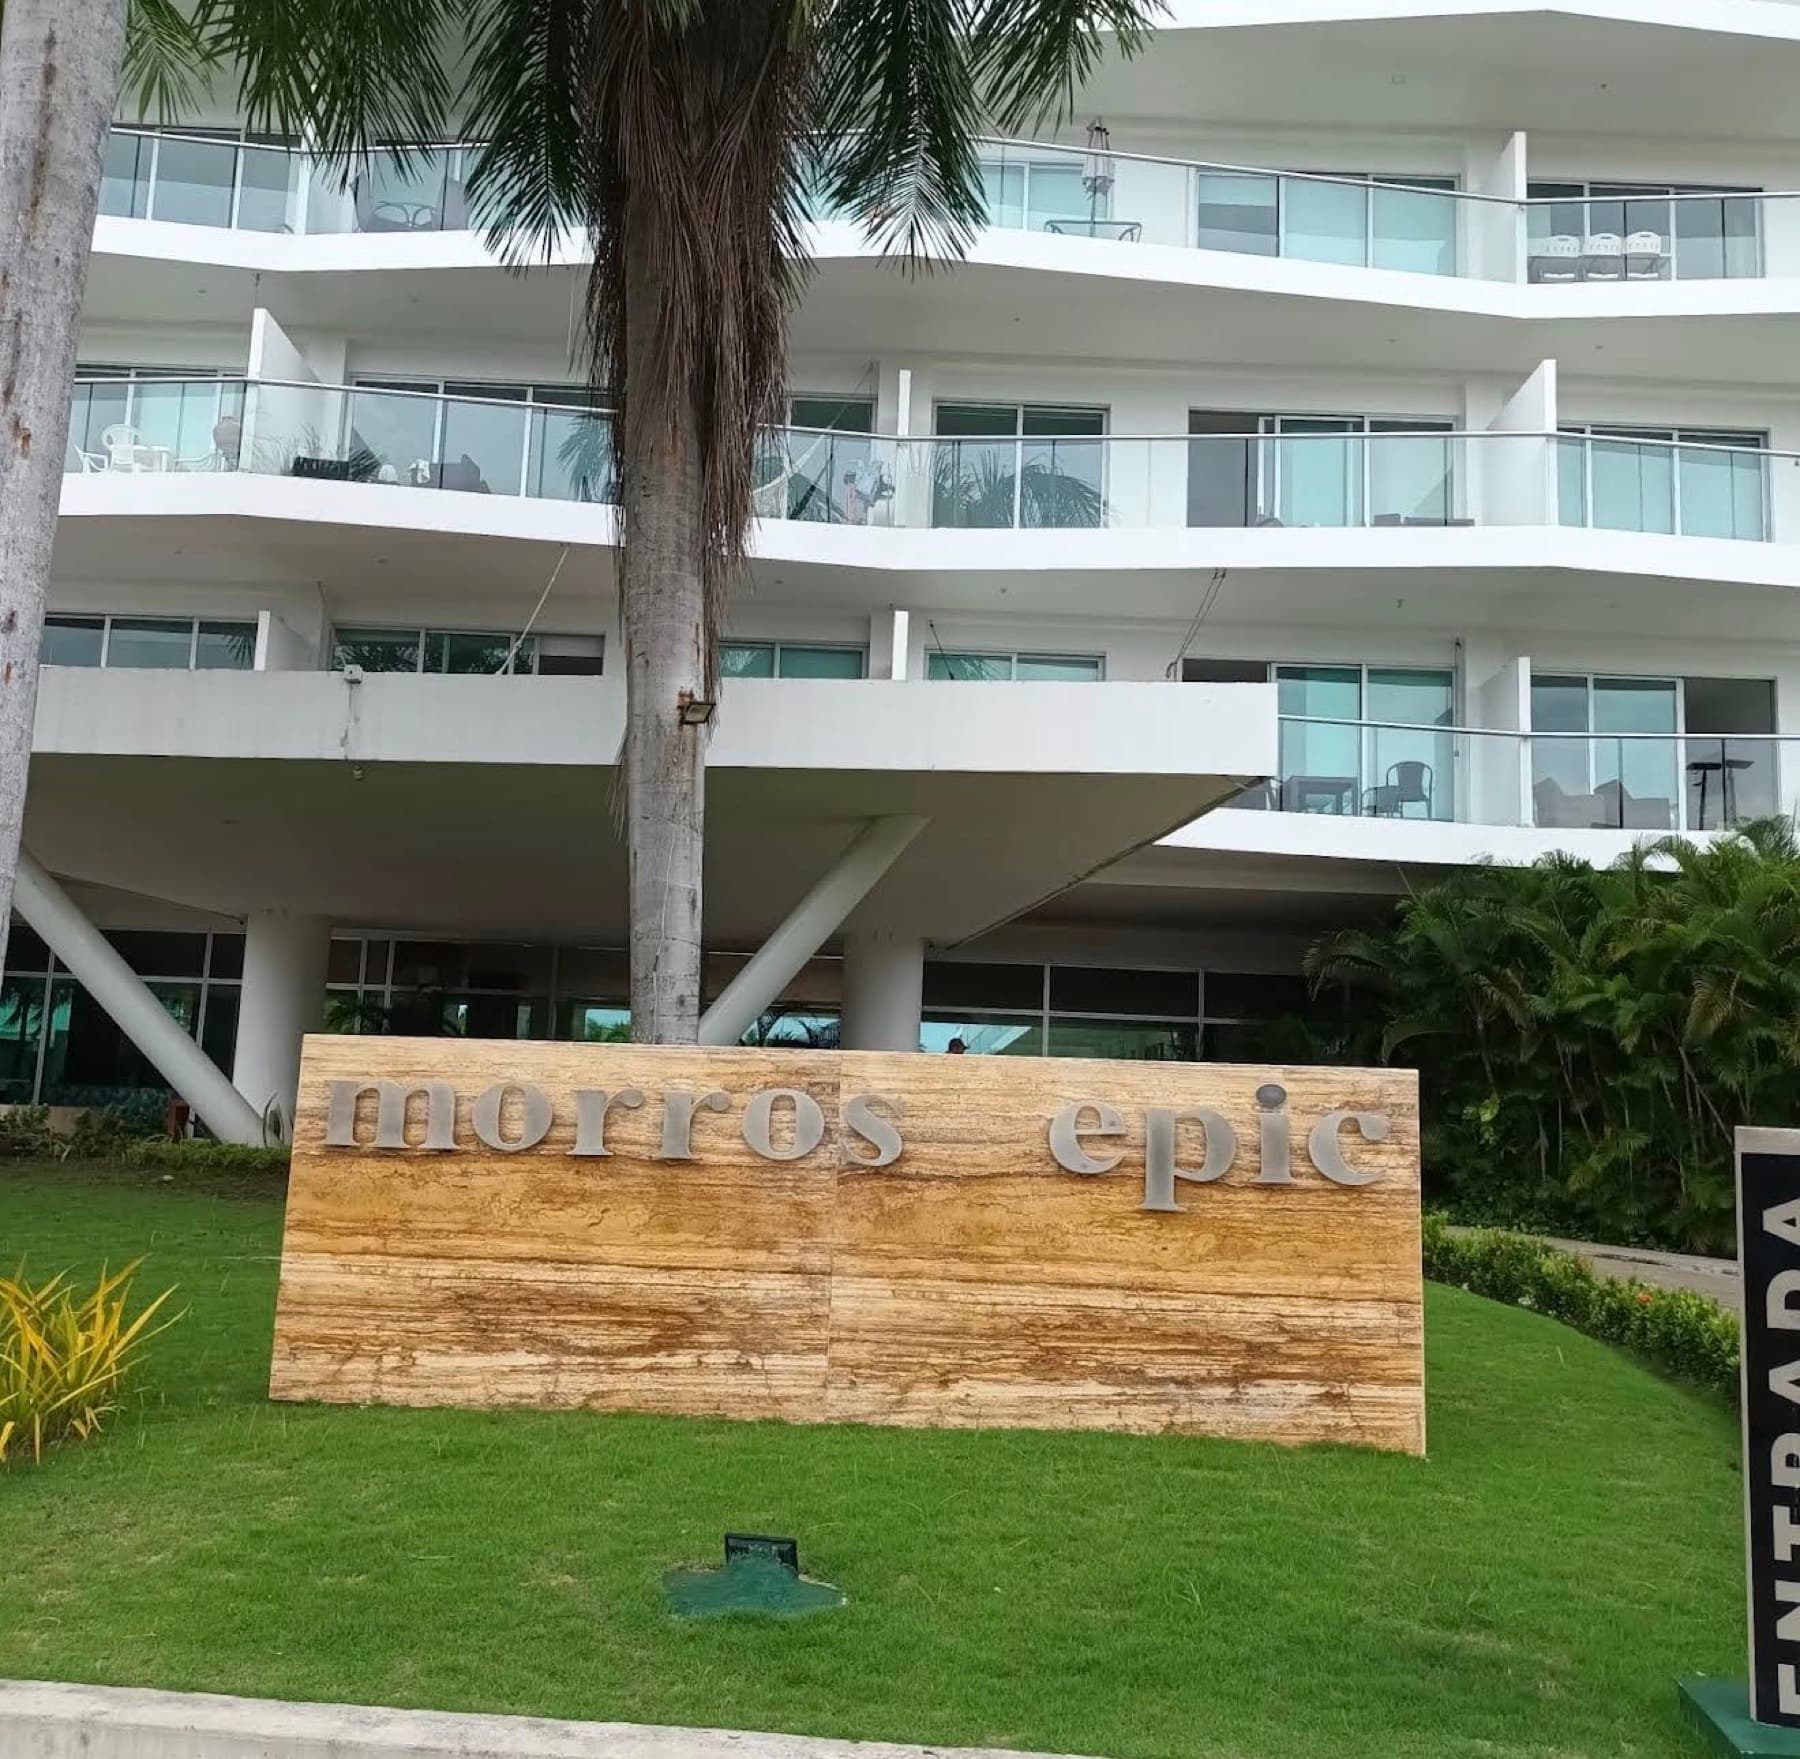
2-bedroom, 2-bathroom apartment, 112.42 m², in Morros Epic, a beachfront residential complex in Cartagena’s North Zone. The complex features several pools surrounded by palm trees, green areas, sun decks, and beach access. Interior images and some views are illustrative.
This property is part of CityFraction's selected portfolio. Each fraction gives you a proportional share of rental income and of the property's appreciation.
Co-owners
Who owns this asset
Financial analysis
Profitability indicators
Gross yield
38,1 %
Annual gross rental income divided by the property value, before expenses and taxes.Net yield
16,8 %
What you actually keep per year after operating expenses and taxes, as a percentage of the property value.Cap rate
18,7 %
Capitalization rate: net operating income (NOI) divided by the property value. It measures the asset's return without financing.Cash-on-cash
16,8 %
Annual cash you receive divided by the cash you invested. Here it matches net yield because there is no debt.Annual appreciation
5 %
Estimated annual increase in property value, based on the area's history and the asset type.Total return
21,8 %
Net yield from rent plus estimated annual appreciation. It's the total expected gain per year.Annual NOI
US$96,8 k
Net Operating Income: effective income minus operating expenses (operator, maintenance, insurance, property tax), before taxes.Net monthly cash flow
US$7,3 K
Annual net income divided by 12. It is the income of an average month, credited daily across all fractions.Payback
6 years
Años necesarios para recuperar la inversión solo con la renta neta, sin contar la valorización.Annual economic breakdown
Simulator
Calculate your investment
Your investment here
16,8 % estimated annual= 10 fractions · minimum 1
US$7,00
1,4 %
Rent / month
US$84,00
16,8 %
Rent / year
US$138,14
27,63 %
Appreciation 5 years
Projected value in 5 years (rent + appreciation)
US$1.058,14
+US$558,14 estimated gain · +111,6 %
Equals 16,2 % anual compuesto
Illustrative estimates based on target yields. Past returns do not guarantee future results.
1Documents
Project documents
How you earn
Investment of short-term rental
- Vacation accommodation in a beachfront complex in Cartagena’s North Zone.
- Estimated net rent between 1.4% and 1.9% monthly on your investment (not guaranteed), plus property appreciation.
⏰ Timeline
Investment timeline
Estimated horizon
5 years
No mandatory lock-up until the end: you can sell your fractions on the marketplace whenever you want.
🗓️ Key milestones
Community
Purchase and repurchase history
12 people are already building wealth in this project. 🎉
- ME 🇨🇴Martín E. Compra · 1 fractionUS$50
🇦🇷Fernando Compra · 8 fractionsUS$400
🇨🇴Jeniffer Compra · 128 fractionsUS$6,4 K
🇲🇽Romia Compra · 100 fractionsUS$5 K
- AS 🇪🇸Andrés S. Compra · 68 fractionsUS$3,4 K
🇵🇦Willie Compra · 388 fractionsUS$19,4 k
🇦🇷Gina Compra · 39 fractionsUS$1,9 K
- MD 🇪🇨Manuela D. Compra · 13 fractionsUS$650
Histories
Rents, transactions and market
Months paid
1
Net rent distributed
US$7,3 K
Average occupancy
75 %
| Month | Occupation | Gross income | Net rent | Per fraction | Status |
|---|---|---|---|---|---|
| November 2026 | 75 % | US$12.340 | US$7.258 | US$0,70 | Paid |
| December 2026 | 82 % | US$13.492 | US$7.935 | US$0,77 | Estimado |
| January 2027 | 73 % | US$12.011 | US$7.064 | US$0,68 | Estimado |
| February 2027 | 69 % | US$11.353 | US$6.677 | US$0,64 | Estimado |
| March 2027 | 78 % | US$12.834 | US$7.548 | US$0,73 | Estimado |
| April 2027 | 81 % | US$13.327 | US$7.838 | US$0,76 | Estimado |
| May 2027 | 70 % | US$11.517 | US$6.774 | US$0,65 | Estimado |
| June 2027 | 71 % | US$11.682 | US$6.871 | US$0,66 | Estimado |
| July 2027 | 81 % | US$13.327 | US$7.838 | US$0,76 | Estimado |
| August 2027 | 78 % | US$12.834 | US$7.548 | US$0,73 | Estimado |
| September 2027 | 68 % | US$11.188 | US$6.580 | US$0,63 | Estimado |
| October 2027 | 74 % | US$12.175 | US$7.161 | US$0,69 | Estimado |
- November 202675 % ocupaciónUS$7.258Paid · US$0,70/fr
- December 202682 % ocupaciónUS$7.935Estimado · US$0,77/fr
- January 202773 % ocupaciónUS$7.064Estimado · US$0,68/fr
- February 202769 % ocupaciónUS$6.677Estimado · US$0,64/fr
- March 202778 % ocupaciónUS$7.548Estimado · US$0,73/fr
- April 202781 % ocupaciónUS$7.838Estimado · US$0,76/fr
- May 202770 % ocupaciónUS$6.774Estimado · US$0,65/fr
- June 202771 % ocupaciónUS$6.871Estimado · US$0,66/fr
- July 202781 % ocupaciónUS$7.838Estimado · US$0,76/fr
- August 202778 % ocupaciónUS$7.548Estimado · US$0,73/fr
- September 202768 % ocupaciónUS$6.580Estimado · US$0,63/fr
- October 202774 % ocupaciónUS$7.161Estimado · US$0,69/fr
Net rent is calculated and credited every day pro rata across all fractions; here it is shown summed by month. Future months are estimates.
Data & projections
Visualizations
Funding status
Valuation (market value)
Inicial
US$481,3 k
Acumulado
+7.7 %
Anual
+5.0 %
Monthly occupancy
Minimum
69 %
Medium
76 %
Maximum
82 %
Monthly income vs. expenses
Min. income
US$11 k
Ingreso medio
US$12,4 k
Max. income
US$13,8 k